Excelmatic.ai
AI Data Analytics, Charts, Reports & Dashboard | RowSpeak.
- Category
- Data Analysis
- Alternatives
- 6 similar tools
- Last updated
- 1 weeks ago
- Source
- Official site ↗︎
AI Collection Top Picks

Data Analysis Category Picks

About Excelmatic.ai
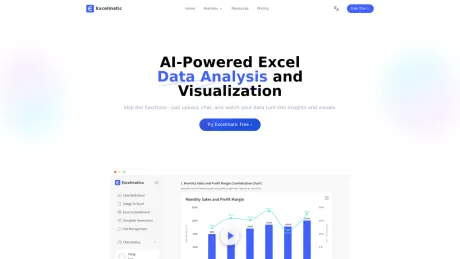
Analyze messy Excel, CSV, PDF, and image tables with AI. Find trends, explain changes, create charts, dashboards, and reports you can review.
What you get
Additional Information
RowSpeak is designed to simplify data analysis for business teams that regularly work with spreadsheets. It allows users to upload various file formats, including Excel, CSV, PDF, and image-based tables, enabling them to ask questions and receive detailed insights without the need for complex formulas or pivot tables. The platform automatically cleans and structures data, making it more accessible and easier to interpret. With RowSpeak, organizations can streamline their reporting processes, transforming raw data into actionable business insights that are ready for presentation.
Key features include the ability to generate charts, dashboards, and reports instantly. Users can create visually appealing outputs such as bar charts, line charts, and KPI visuals, which aid in performance tracking and forecasting. The tool also supports natural language queries, making it user-friendly for those who may not be data-savvy. It is suitable for various sectors including finance, marketing, supply chain, and sales, providing tailored solutions that address specific operational needs.
Additionally, RowSpeak focuses on building repeatable workflows for recurring analysis tasks, enabling teams to save time and reduce manual errors. It offers features like AI-driven reporting, the ability to generate templates, and capabilities to visualize complex data patterns over time. This positions RowSpeak as a robust solution for teams looking to enhance their data handling and decision-making capabilities, transforming traditionally cumbersome processes into efficient workflows.
Frequently asked questions
What is Excelmatic.ai used for?
AI Data Analytics, Charts, Reports & Dashboard | RowSpeak.Is Excelmatic.ai free?
Pricing for Excelmatic.ai varies — see the Pricing section for details.What are alternatives to Excelmatic.ai?
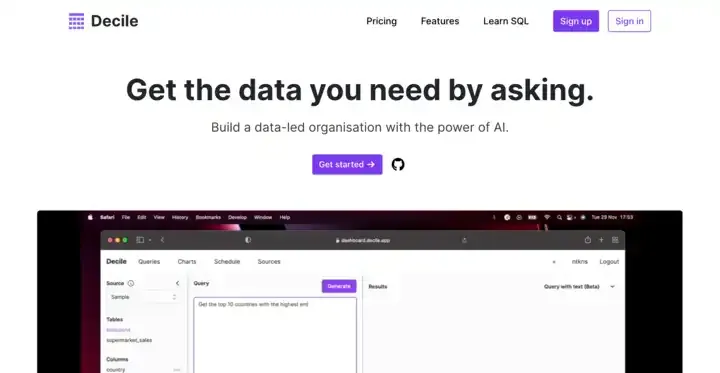
Top alternatives to Excelmatic.ai include LLM-Powered Invoice & Receipt Extractor (OSS), AutoPredict, Genius Sheets, NewsDeck from OneSub, Decile.Where can I get Excelmatic.ai?
Excelmatic.ai is available at https://excelmatic.ai/.What category is Excelmatic.ai in?
Excelmatic.ai is listed in Data Analysis.What is an Excel AI agent?
An Excel AI agent is an AI system that helps you work through spreadsheet tasks end to end, not just answer one question. RowSpeak can read Excel, CSV, PDF tables, and pasted data, then help clean fields, calculate metrics, create charts, explain changes, and generate reusable analysis outputs.Who is it for?
It is suitable for people working in marketing, finance, operations, and other roles that rely on spreadsheet data. ---Can RowSpeak work as an AI graph maker?
Yes. RowSpeak can work as an AI graph maker for spreadsheet data. You can upload Excel or CSV files, paste a table, or use extracted PDF table data, then ask RowSpeak to create bar charts, line charts, pie charts, KPI visuals, and other business-ready graphs.Features
- Supports structured spreadsheet workflows - Helps analyze and summarize datasets - Assists with report preparation - Reduces repetitive formatting work ---Can AI create graphs from Excel data?
Yes. AI can create graphs from Excel data by understanding the columns, measures, categories, and trends in your spreadsheet. RowSpeak helps choose suitable chart types, generate the visual, and explain what the graph shows so the result is easier to review and share.Use Cases
- Preparing business reports from Excel data - Organizing marketing or financial datasets - Maintaining consistent spreadsheet structure ---Can RowSpeak turn Excel into a dashboard?
Yes. RowSpeak can turn Excel exports and CSV files into dashboard-style KPI views. Instead of manually rebuilding charts and summaries, you can ask RowSpeak to organize key metrics, create visuals, and produce a dashboard-like output your team can review and reuse.Video Preview
https://excelmatic.ai/How is RowSpeak different from ChatGPT for Excel?
ChatGPT is a general-purpose AI assistant, while RowSpeak is built for spreadsheet-heavy workflows. RowSpeak focuses on file upload, data structure, metric calculation, graph generation, assumption review, and reusable business reporting, which makes it more practical for Excel data analysis tasks.How is RowSpeak different from Excel Copilot?
Excel Copilot works inside Microsoft Excel and is useful for in-sheet assistance. RowSpeak is designed for broader business files and workflows, including Excel, CSV, PDF tables, image tables, pasted data, charts, dashboards, and report-ready summaries that can be reused outside a single workbook.Can RowSpeak analyze PDF tables or image tables?
Yes. RowSpeak can help analyze PDF tables, screenshots, and image-based tables by extracting structured data where possible and turning it into charts, summaries, and business insights. This is useful when important data lives outside clean Excel files.What is the best AI for Excel data analysis?
The best AI for Excel data analysis depends on the workflow. If you only need formula help, an in-spreadsheet assistant may be enough. If you need to upload messy files, ask business questions, create graphs, inspect assumptions, and generate reports, RowSpeak is designed for that broader analysis process.Is RowSpeak a BI tool?
RowSpeak is not a traditional BI tool. It is lighter and faster for file-based analysis workflows where teams need to turn Excel, CSV, PDF tables, or pasted data into insights, graphs, dashboards, and reports without building a full BI stack.Can RowSpeak replace pivot tables for quick analysis?
For many quick analysis tasks, yes. RowSpeak can summarize data, group categories, compare segments, create charts, and explain changes without manually building pivot tables. For highly customized spreadsheet models, pivot tables may still be useful.Can RowSpeak identify patterns in historical data?
Yes. RowSpeak can analyze historical Excel, CSV, PDF table, or pasted data to surface trends, seasonality, anomalies, segment changes, and other patterns that help explain what changed over time.What data sources can I upload?
You can upload Excel files, CSV exports, PDF tables, screenshots, image-based tables, and pasted data. RowSpeak is especially useful for messy business exports that need cleaning, analysis, charts, dashboards, or report-ready summaries.Is RowSpeak a real-time dashboard tool?
RowSpeak is not a live real-time dashboard platform. It is built for file-based analysis and dashboard-style outputs from spreadsheets and business exports. For continuously refreshed operational dashboards, a traditional BI or data warehouse setup may still be the better fit.What files can I upload?
You can upload spreadsheets, CSV files, PDF tables, screenshots, and exported business reports. RowSpeak is designed for the files businesses already use in their daily workflows.Do I need a database or data warehouse?
No. You can start by uploading the files you already have. A warehouse or live data connection is not required for the initial workflow.Can RowSpeak analyze financial data?
Yes. RowSpeak can help analyze cash flow, expenses, margins, budget variance, profit trends, and other financial reporting files.Can I review the analysis before sharing it?
Yes. RowSpeak is designed around reviewable outputs. You can inspect the result, adjust important assumptions, change visuals, and refine the report before sharing it.What happens if the AI chooses the wrong field or metric?
You can correct key assumptions such as the revenue field, date range, grouping dimension, refund treatment, or chart type without rebuilding the entire analysis.Is on-premise deployment available?
Yes. On-premise deployment is available for organizations that need to run RowSpeak within their own infrastructure. Contact us to discuss deployment requirements.Can individual analysts use RowSpeak?
Yes. RowSpeak is designed for individual analysts, finance professionals, operators, business owners, and teams working with recurring business reports.Can RowSpeak connect to Google Analytics, Google Sheets, or databases?
Not yet. Direct connectors to tools like Google Analytics, Google Sheets, and databases are coming soon. In the meantime you can upload exports from those tools and run the same analysis and reporting workflow on them.
Compare Excelmatic.ai with…
Pick any tool to see a structured side-by-side: pricing, deployment, capabilities, and content policy.